Seeking Eureka Website Seeking Eureka Website
  • Services
    • All services
    • Risk Quantification
    • Third-Party Risk
    • Tail-Risk + Capital Modeling
    • Fractional Risk Services
  • How We Work
  • Insights
  • Projects
  • Apps
  • About
  • Contact

Apps

Each app on this page teaches one quantitative risk method by letting you run it. Each one takes a single problem, such as a batter’s season average, a VaR model’s breach count or a register of cyber loss scenarios, and works through the model one step at a time. When you change an input, the estimate, the uncertainty range and the charts update right away. You see what the math is doing instead of taking it on faith.

All the apps use the same layout. The Simulator tab holds the inputs, results and charts. The Guide & Math tab explains the model in plain language, and its worked examples recalculate from whatever values you enter. Each app comes loaded with illustrative data, so you can start right away and then swap in your own figures. Everything runs in your browser with no account or install, and each app’s source code is public on GitHub.

These are teaching tools, not production systems. They favor clear, visible math over regulatory or forecasting precision. They work best for building intuition, training a team, or explaining a method to a board before you commit to it. One or two new apps are added each month, covering Bayesian methods, simulation, tail risk and network analysis. When you’re ready to apply these methods to your own data, that’s the work Seeking Eureka does.
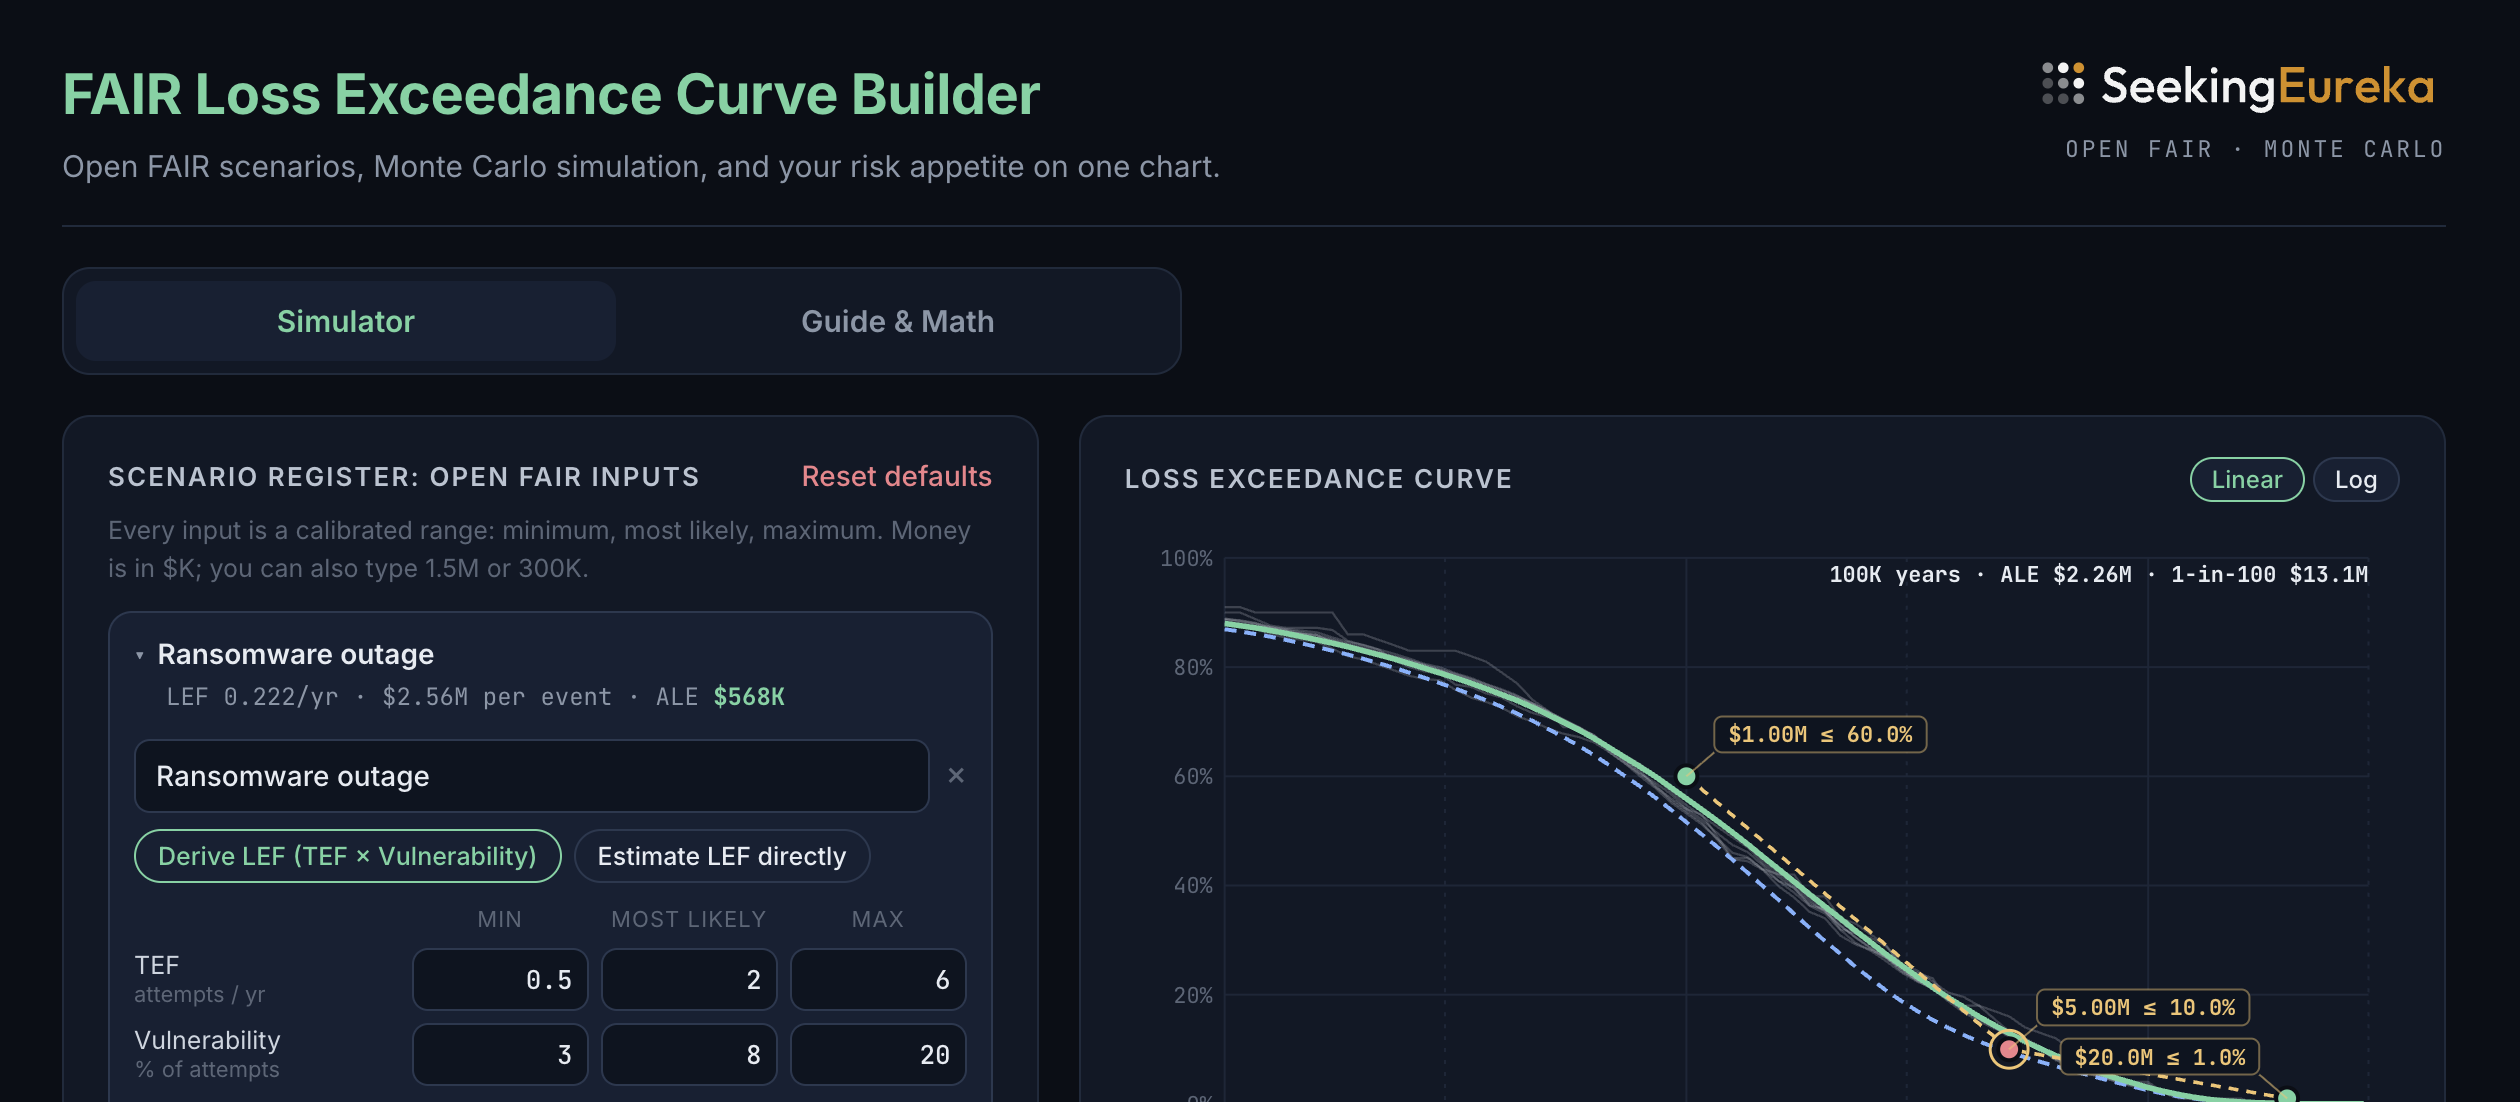
FAIR Loss Exceedance Curve Builder
FAIR
Loss Exceedance Curve

Learn cyber risk quantification with Open FAIR. Enter loss scenarios as calibrated ranges, simulate up to 100,000 years, and build a loss exceedance curve. Test it against your risk appetite, find the 1-in-100 year loss, and see whether a proposed security control pays for itself.

Nov 1, 2026

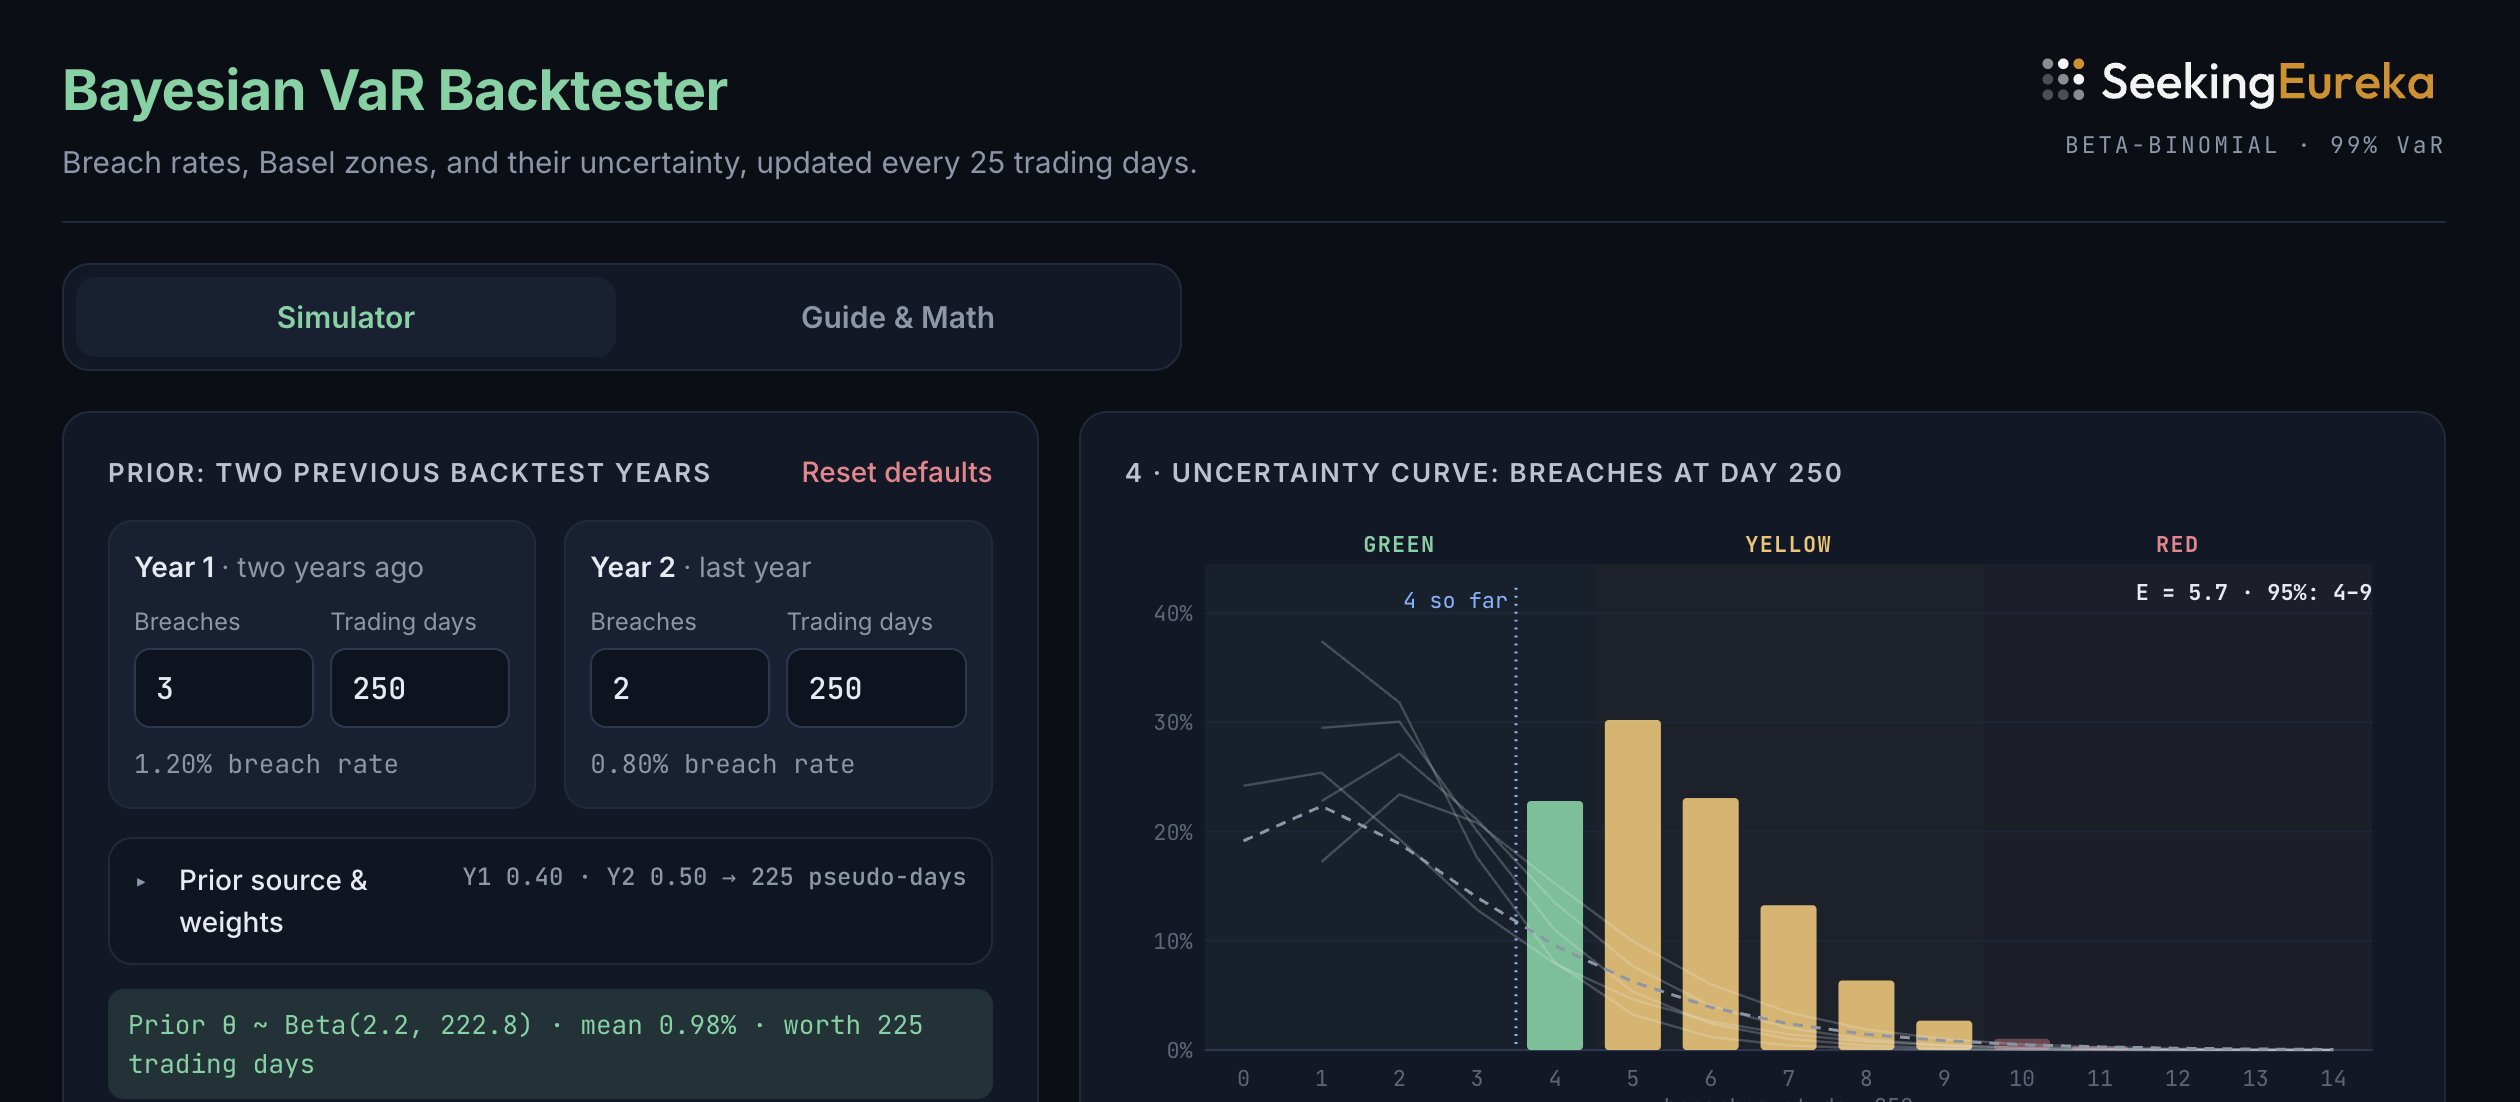
Bayesian VaR Backtester
Bayes' Theory
VaR

Learn Bayesian updating through VaR backtesting. Track a 99% one-day VaR model’s breaches over a 250-day year and forecast its year-end Basel traffic-light zone after every 25-day window, with a 95% range, the posterior breach rate, and a simple check for clustered breaches.

Oct 15, 2026

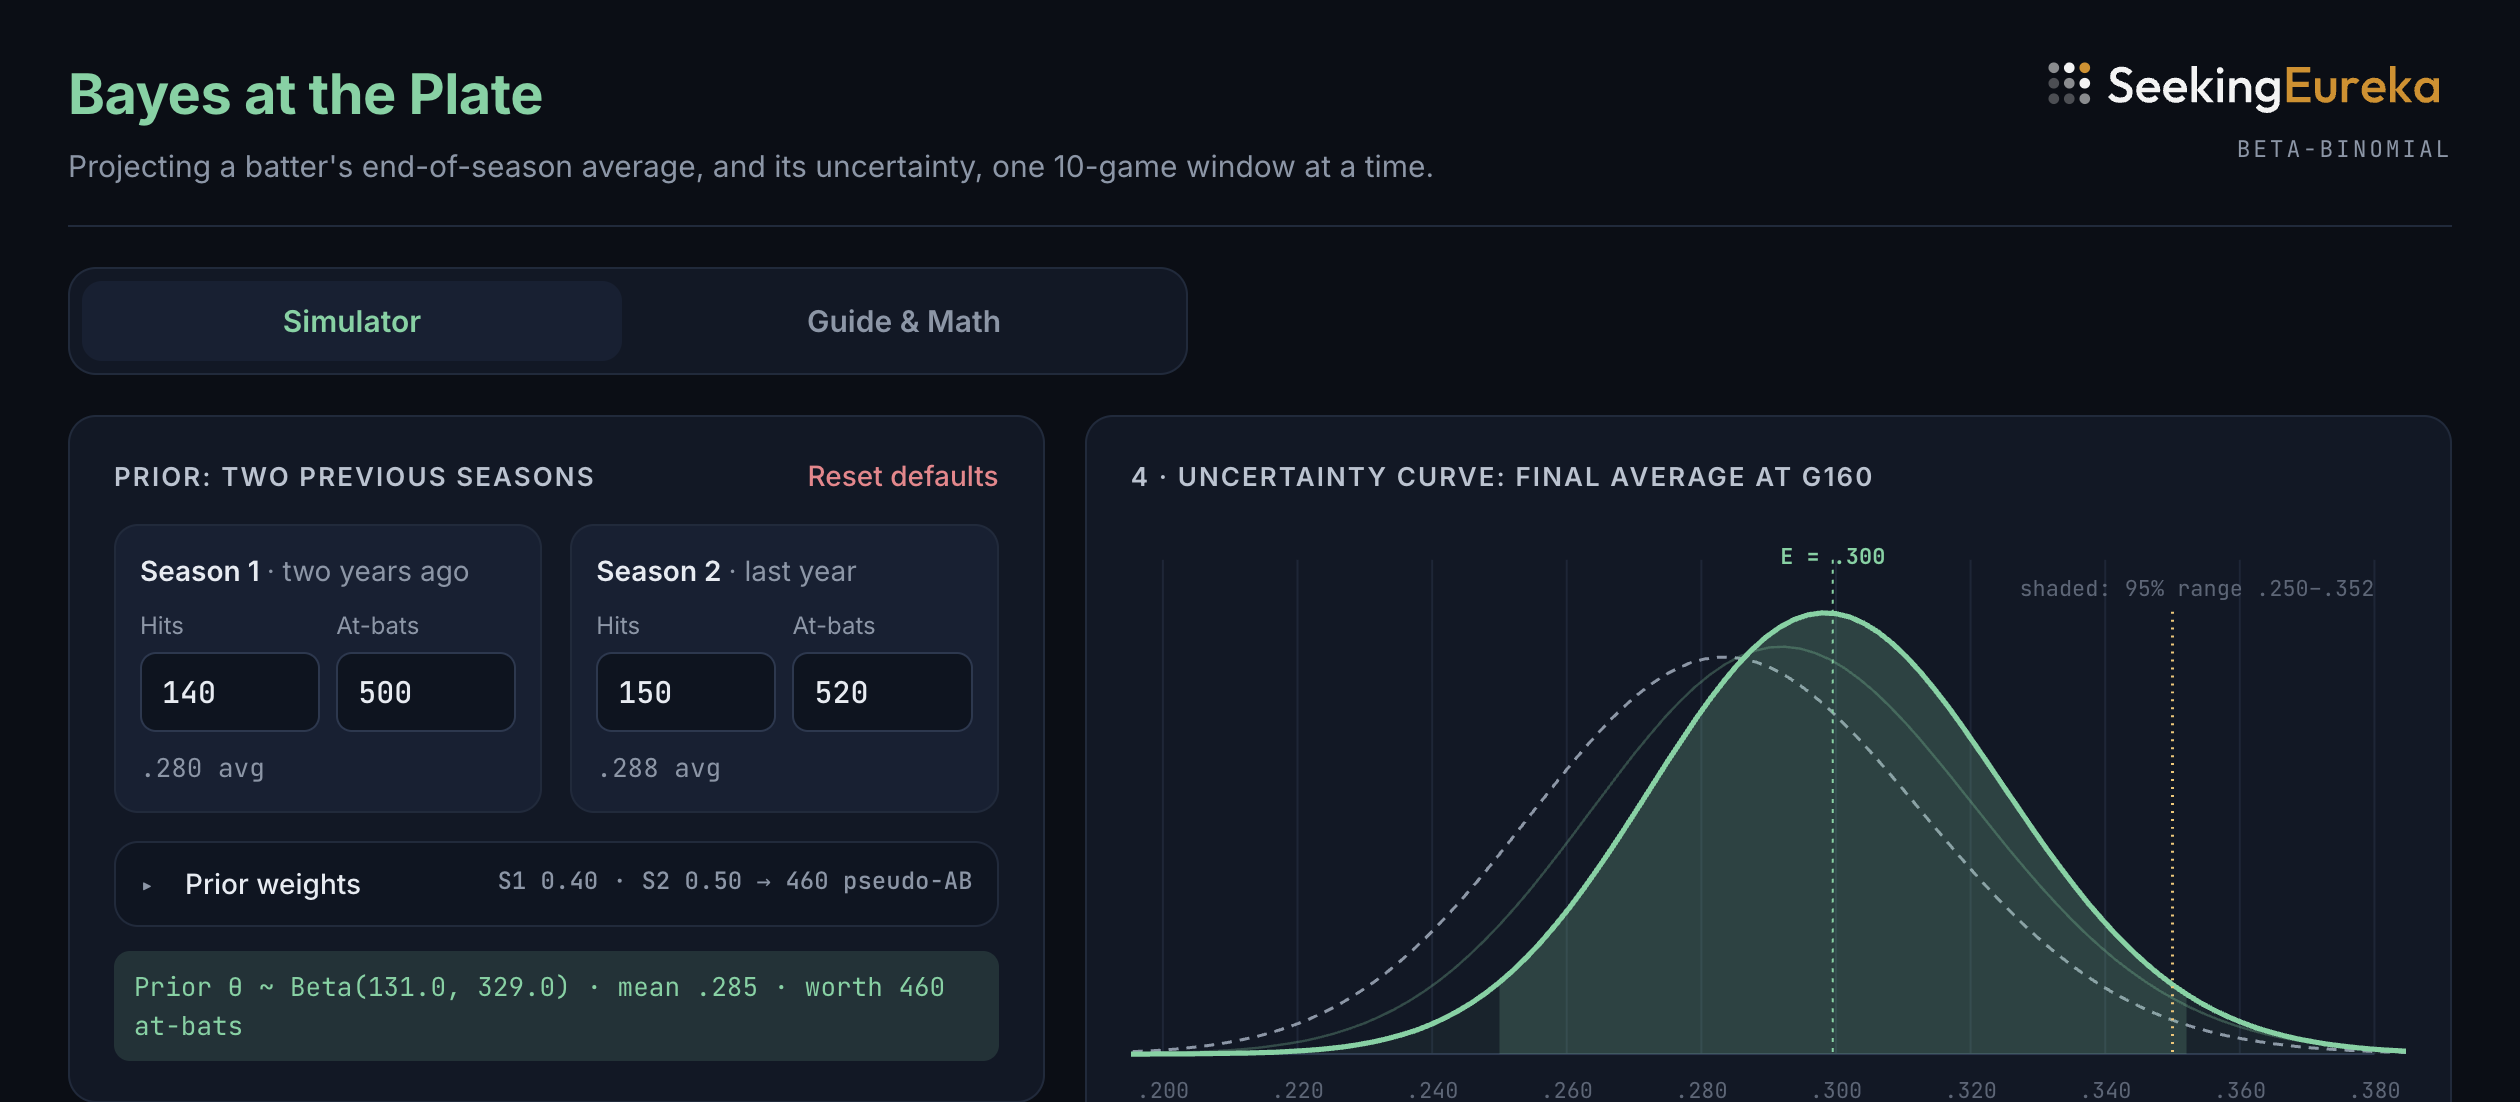
Bayes at the Plate
Bayes' Theory
Baseball

Learn Bayes’ theorem through baseball. Blend two prior seasons into a prior, then update a batter’s projected final average every 10 games of a 160-game season. Watch the 95% range narrow as luck and uncertainty about his true talent shrink, with every step of the math shown.

Oct 1, 2026
No matching items
 

© 2026 Seeking Eureka LLC • Princeton, NJ • email • LinkedIn • Substack • Medium